Following my Growth marketing checklist for FinTech, which was written some posts ago, let’s consider today a A/B or Split testing.
Imagine, you want to move a certain call-to-action (CTA) button to the top of your homepage instead of keeping it in the sidebar and improve its click-through rate.
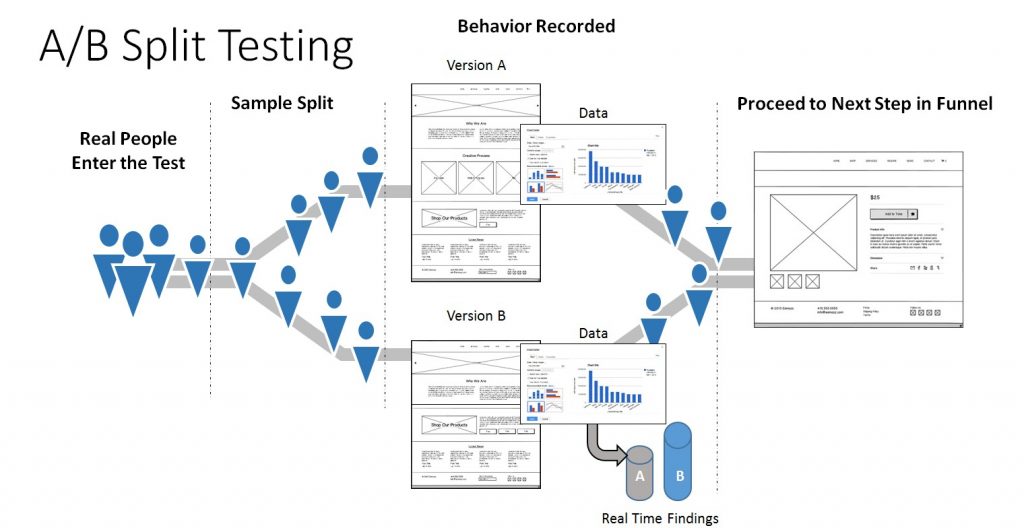
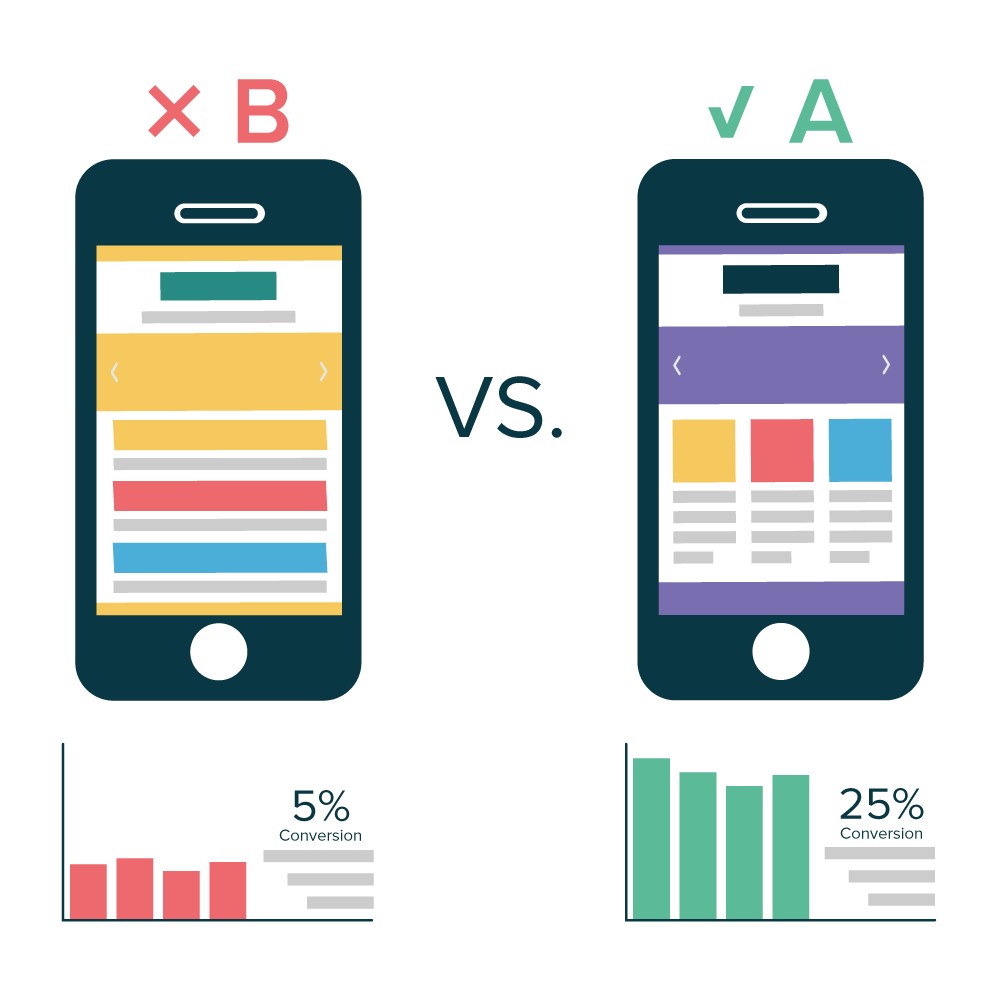
To A/B test this hypothesis, you need to create another, alternative web page that reflected that CTA placement change. The starting design — or the “control” — is Version A. Version B is the “challenger.”
Then, you test these two versions by showing each of them to a predetermined percentage of site users. In Ideal case, the percentage of users seeing B version is the same.
For FinTech, probably, you aware about what key areas to test to increase lead generation and subscriber growth is your optin form. This is where people sign up to become subscribers or leads.
But in these optic forms, where exactly you should focus on? I recommend you the next areas:
- Headlines and subheadings
- Copy
- Form design
- Call to action (CTA)
- Images
- Colors
If you’re testing forms or split testing your web page, there are some best practices that always apply:
Test the right items
Hubspot advises to optimise the most visited pages:
- Home page
- About page
- Contact page
- Blog page
If you concentrate on lead generation, then consider the option forms on:
- Webinar signup page
- Ebook landing page
- Lead magnet page
All that you may do in free Google Analytics, go to Behavior —> Site Content —> All Pages.
After getting you know what these are, you’ll know where to place email subscription and lead magnet optin forms.
Sample size
You should perform your test on enough people, otherwise you won’t get reliable results. But if one campaign gets 150% more engagement compared with other, that’s great. If you have a total traffic 20 readers. Then you actually don’t have much reliable data because your test sample is too small. According to Nielsen Norman Group research (www.nngroup.com/), the minimal audience per day should be 5 000 user, duration 18 days, with 3 variations.
For newsletter test audience starts from 1000 recipients.
Reliable data
There’s another important measure of data reliability or statistical significance. This is a way of determining that your results aren’t caused by random chance.
To identify statistical significance for your A/B test, use Visual Website Optimizer’s statistical significance tool.
The P-value tells you whether the test has statistical significance. If you get a Yes, congrats! If you get a No, you may need to go back to adjust your metrics.
Check hypothesis
Before any testing make a hypothesis, to avoid a wasting time.
- What you need to test?
- Why it needs to be tested?
- What changes do you expect?
With this structure, you’ll know the scope of your test and when it succeeds or fails.
Use the next format, which is very close to Scrum User Stories: As a <role>…, I want to <perform task>…, so that I can <achieve goal> | Acceptance criteria: Given, When, Then
But a bit more complicated:
Because we obtained A and feedback B, we believe that changing C for users D will make E happen. When we see F and receive G, it confirms our hypothesis.
Well, you may use one of them doesn’t matter which one.
For instance, email newsletter optin form:
Because we observed a low conversion rate A and users complained that a form was too long B, we believe that reducing the number of form fields C for all users D will increase newsletter signups E.
It confirms our hypothesis when we get an increase in newsletter signups for 2 weeks testing F and get customer feedback that reflects that people think the optin form is less complicated G.
Correct test schedule
The one of the most crucial A/B testing best practices is a scheduling. You’ll get reliable results only if you run your A/B tests for comparable periods. Keep in mind also seasonal peaks and plateaus, Black Friday, Christmas, New Year and etc.
Check your traffic performs in Google Analytics. Go to Audience —> Overview. In calendar —> Last 30 days. After that click on Compare To, the previous 30 days will automatically be selected. —> Apply
Thus you get a better idea of traffic patterns and can select an ideal period to run your A/B test.
Test duration
If you’re running a test with several variants and want 500 conversions, you’ll need to test for a longer time than you would for a test with one variant and 100 expected conversions.
I prefer 7 days with 2 or 3 variants and ~29 or 43 conversions per day. Or you may use for it a calculator vwo.com/tools/ab-test-duration-calculator
No mid-test changes
Don’t interrupt the test before the end of the ideal testing period, and do not enter new elements that weren’t part of your original hypothesis, otherwise all your results won’t be reliable.
Better is to stay strong, sit and wait for the results to come in, and take action only after the end of testing.
One element in one time
One golden rule of A/B testing: test one element at a time, to evaluate how effective a change is.
If you’re testing a marketing optin form, the changes in the headline, in the call to action, in the number of form fields. Thus you never know which ONE element makes a difference in your lead conversions.
If you need to test more than one element, you need multivariate testing. Next time about it.
Control variations
Many variations at once is a classic split testing mistake. The more variations you have, the longer you need to run the tests to receive reliable results.
A/B testing best practices advices: To reach the best balance of test duration and efficiency, choose between 2 and 4 variations at the same time.
Focus on data
Check your hypothesis, entrust the data, not your intuition. If you follow my advice on how to create split tests, you obtain reliable data that’ll help you to improve conversions.