To eliminate possible problems with your product management and mitigate risks, it is important to understand which metrics indicate them, and which reflect complete story about your customers, your business and the market, understand a correlation between them and leverage it.
Operating in a high competitive sector, FinTech companies gathering big data feeds should ask themselves:
- Are they poised to take advantage of market opportunities the moment they emerge?
- How do they diagnose and fix incidents before they have time to impact my business?
- Do they monitor the information they need to stay ahead? Are they monitoring the right data?
Furthermore, each metric tells you so much in isolation. To provide a proper FinTech analysis you have to map out the complex relationships between how your product or app is functioning, do your marketing efforts perform well and figure out how it all fits together.
Let’s consider metrics to focus on.
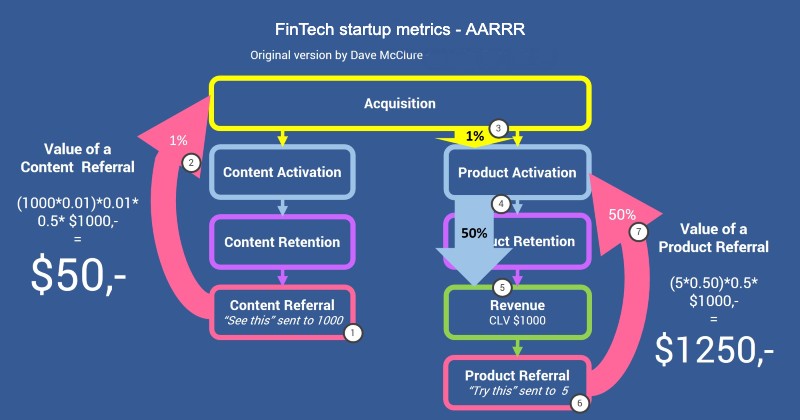
Probably you have heard about AARRR. All of them indicate a customer behavior, which is vital for comprehension your performance – but they miss out key areas: marketing and technical.
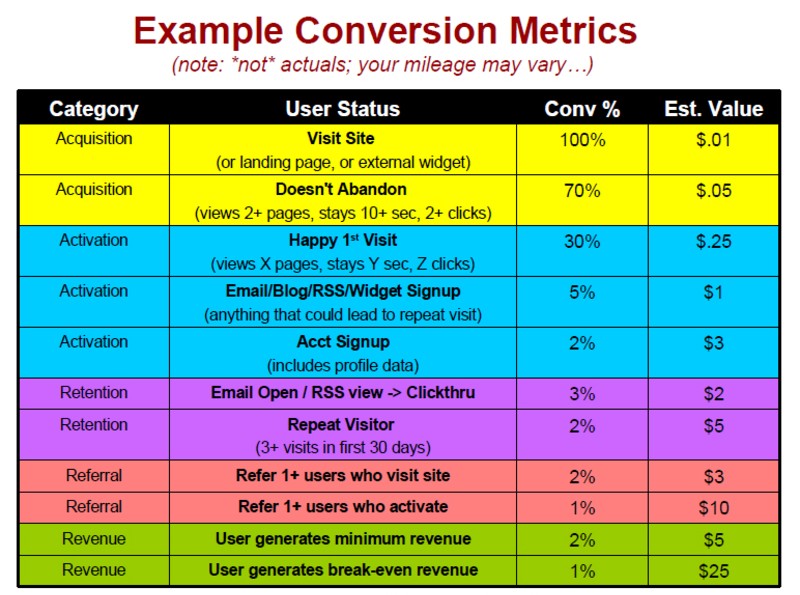
A holistic view of your FinTech business usually rely on next 7 metrics:
Acquisition Metrics
They point out how many new customers you onboard. For instance, KPIs such as app downloads & new user account creation rate. Cost per acquisition, keep it as low as possible: If your CPA is too high, change your customer acquisition approach or channels, review advertising strategies or switch to in-person events.
Activation Metrics
It reflects how good you incentivise people to use your product. KPIs typically include Monthly Active Users (MAUs) and app/site traffic.
Retention Metrics
Here, you measure a success at keeping people engaged with your product – especially important if your business is subscription-based. Other KPIs: active/inactive accounts and returning customers.
To calculate your overall retention or churn rate, divide your active users that continue their subscriptions by the total number of active users in a time period.
20/100 = 0.02 *100% = 20% retention rate.
8 of your 100 users churn—that’s a 8% user churn rate, or a 92% user retention rate. A successful sale with an existing customer is 60-70% and get more is impossible.
Around 70% of SaaS leaders said that acquisition was their biggest goal, while about only 20% believed customer retention was their most important goal. That’s not to say SaaS leaders don’t care about retention—they just aren’t prioritising it or putting in the effort to optimise it.
Referrals
The best possible feedback your customers can give you, is when they recommend your product to others.
If you have a strong performance in this area you definitely observe a business growth. Keep eye on KPIs such as social shares, sent & saved posts, push referrals.
Revenues
Consider KPIs such as daily/monthly revenue, number of transactions/deposits to understand an entire picture of performance.
Marketing Metrics
Earlier I wrote about them, but shortly remind you important KPIs include conversion rates, web traffic sources, cost per lead and customer lifetime value.
Technical Metrics
which are usually overlooked, are critical for SaaS or app-based company, especially in fintech where users entrust to you their savings.
Monitor page load times, rates of timeouts (for Swiss UBS bank ~ 2.5 min), number of simultaneous connections, and percentage of database memory used to make sure your delivery stays smooth and frictionless.
All tools to track these metrics usually integrated with data collection points or CRM via API. Thus you may utilise a lot of dashboarding tools to visualise KPIs, even BI platforms for detailed data analysis and querying.
But when it comes to identifying anomalies, these tools tend to be pretty weak. Due to these outlying results which might be caused by factors from different KPIs or areas of the business that aren’t indicated by the same metric, such as a technical glitch causing a sudden drop in sales.
According to Gartner, 46% of marketing teams say that their data scientists dedicate significant time to preparing data for analysis, while 48% say they take the lead on data visualisation.
Consolidate all insights together
Today new generation of analytic tools, interchangeably referred to AI analytics relying on the source, identifies patterns, correlations and anomalies, and helping you identify blind spots to make decisions based on the complete facts.
If you prefer a platform based on machine learning, it will even keep improving and honing its approach as it goes. Then you even detect anomalies in real time without wasting man-hour time.
By doing that, you reach a holistic picture of the financial and technological sides of your company in one hand with granular details, allowing you to fix issues, identify spot patterns and opportunities faster than ever before.